
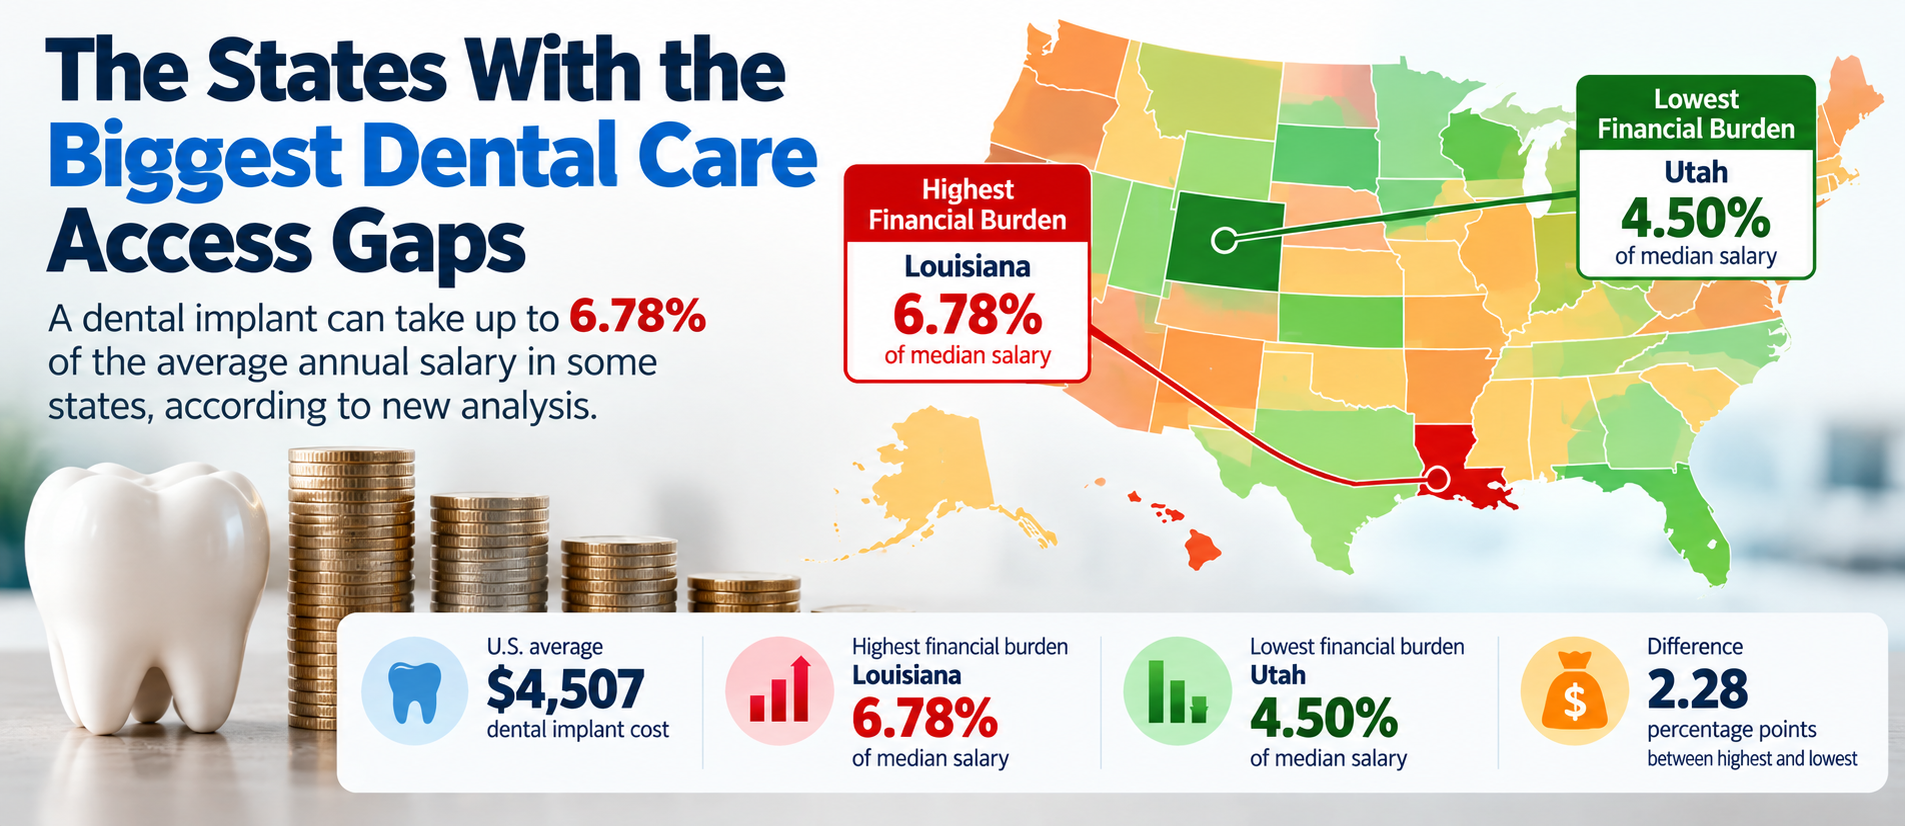
The financial barrier to dental treatment varies significantly across America, with one dental implant representing 6.78% of the median annual salary in the state with the largest income burden, according to a new analysis of dental implant prices and state salaries.
Access to dental care isn’t only about whether a dentist is available nearby.
For patients who need expensive treatment such as a dental implant, the ability to pay for treatment can also be an important part of access.
To examine this financial barrier, we compared the average cost of a complete single dental implant with the median annual salary in each U.S. state.
The analysis found that the financial burden varies considerably across the country.
In Louisiana, the average dental implant represents 6.78% of median annual salary, the highest proportion among the 50 states analyzed.
At the other end of the scale, an implant in Utah represents 4.50% of median annual salary.
The difference between the two states is 2.28 percentage points.
Key findings
- Louisiana has the highest financial dental-care burden, with an implant representing 6.78% of median annual salary.
- Mississippi ranks second, at 6.57%.
- West Virginia ranks third, at 6.53%.
- New York ranks fourth, at 6.48%.
- Utah has the lowest financial burden, at 4.50%.
- Colorado has the second-lowest burden at 4.67%.
- Maryland ranks third-lowest at 4.80%.
- The analysis covers 50 states. Washington, D.C. is excluded because comparable salary data was not supplied.
- The analysis measures financial affordability, not the physical availability of dentists or dental practices.
Where Is The Financial Barrier To Dental Treatment Highest?
The following states have the highest dental implant cost relative to median annual salary:
| Rank | State | Average implant cost | Median salary | Implant as % of salary |
| 1 | Louisiana | $4,137 | $60,986 | 6.78% |
| 2 | Mississippi | $3,885 | $59,127 | 6.57% |
| 3 | West Virginia | $3,969 | $60,798 | 6.53% |
| 4 | New York | $5,565 | $85,820 | 6.48% |
| 5 | New Mexico | $4,305 | $67,816 | 6.35% |
| 6 | Arkansas | $3,833 | $62,106 | 6.17% |
| 7 | Oklahoma | $4,053 | $66,148 | 6.13% |
| 8 | Kentucky | $3,948 | $64,526 | 6.12% |
| 9 | Maine | $4,620 | $76,442 | 6.04% |
| 10 | Montana | $4,515 | $75,340 | 5.99% |
1: Louisiana has the largest financial gap
Louisiana has an average dental implant cost of $4,137.
That is actually below the national implant average of $4,507.
However, the state’s median salary is $60,986.
When the two figures are compared, the implant represents 6.78% of median annual salary, the highest percentage among the 50 states.
This illustrates an important distinction between treatment price and financial affordability.
A state does not need to have the most expensive dental treatment to have one of the largest financial barriers to receiving it.
2: Mississippi follows
Mississippi has one of the lowest implant prices in the country, with an average cost of $3,885.
But its median salary is $59,127.
The resulting implant-to-income ratio is 6.57%, placing Mississippi second in the analysis.
3: West Virginia ranks third
West Virginia’s average implant cost is $3,969, compared with a median annual salary of $60,798.
That means a complete single implant represents 6.53% of median annual salary.
The state therefore has the third-highest financial burden in the analysis.
The States With The Smallest Financial Access Gap
At the opposite end, several states have higher median salaries relative to their average implant prices.
| Rank | State | Average implant cost | Median salary | Implant as % of salary |
| 1 | Utah | $4,347 | $96,658 | 4.50% |
| 2 | Colorado | $4,538 | $97,113 | 4.67% |
| 3 | Maryland | $4,935 | $102,905 | 4.80% |
| 4 | New Jersey | $5,040 | $104,294 | 4.83% |
| 5 | Connecticut | $4,683 | $96,049 | 4.88% |
| 6 | Massachusetts | $5,145 | $104,828 | 4.91% |
| 7 | Virginia | $4,578 | $92,090 | 4.97% |
| 8 | Washington | $4,935 | $99,389 | 4.97% |
| 9 | New Hampshire | $4,998 | $99,782 | 5.01% |
| 10 | Minnesota | $4,410 | $87,117 | 5.06% |
Utah has the lowest ratio in the analysis.
Although the average implant costs $4,347, the state’s median salary of $96,658 means the treatment represents 4.50% of median annual salary.
Colorado follows at 4.67%.
The Surprising Difference Between Price and Financial Access
One of the most interesting findings is that the states with the cheapest implants don’t necessarily have the smallest financial barriers.
For example:
Alabama has the lowest implant price in the country at $3,759.
But its median salary is $66,659, meaning the implant represents approximately 5.64% of median salary.
Louisiana’s implant costs more at $4,137, but its lower median salary means the implant represents 6.78% of median salary.
This creates a useful distinction: The cheapest dental treatment isn’t necessarily the most financially accessible treatment.
The same pattern can be seen at the other end of the market.
California has the country’s highest average implant price at $5,733, but its median salary of $100,149 means that an implant represents approximately 5.73% of median salary.
California therefore has a higher treatment price than Louisiana but a lower implant-to-income burden.
How Big Is The Gap?
Across the 50 states analyzed, the implant-to-median-salary ratio ranges from:
4.50% — Utah
to:
6.78% — Louisiana
The difference is 2.28 percentage points.
While that may appear relatively small, the comparison highlights how state income levels can substantially change the financial context of the same type of dental treatment.
The National Dental Implant Average
The underlying dental-cost dataset puts the average cost of a complete single dental implant at $4,507 across the U.S. market.
But the financial impact of that price varies depending on local earnings.
For a state with a median salary of around $60,000, a $4,500 treatment represents a considerably larger share of annual earnings than it does in a state where the median salary approaches or exceeds $100,000.
This is why the analysis looks at implant cost relative to income, rather than simply ranking states by treatment price.
What does “Dental Care Access” Mean In This Analysis?
For this study, access is considered from a financial affordability perspective.
The analysis asks: How high is the cost of one complete dental implant relative to the median annual salary in each state?
A higher percentage indicates that the treatment represents a larger share of typical annual earnings.
A lower percentage indicates that the treatment represents a smaller share of typical annual earnings.
This should not be confused with physical access to dental services.
The dataset does not measure:
- Number of dentists
- Dentist-to-population ratios
- Dental Health Professional Shortage Areas
- Distance to a dental practice
- Insurance coverage
- Dental appointment availability
- Percentage of residents visiting a dentist
Those measures would require additional datasets.
Methodology
The analysis combines:
1: Dental implant prices: Average cash price of a complete single dental implant across the 50 U.S. states and Washington, D.C., from the supplied 2026 US Dental Restorative Cost Index by State dataset.
2: Salary data: State-level average and median salary figures supplied for this analysis.
The financial access measure is calculated as:
3: Implant Financial Burden = Average Dental Implant Cost ÷ State Median Salary × 100
For example, Louisiana $4,137 ÷ $60,986 × 100 = 6.78%
Median salary is used as the primary income measure rather than average salary.
Washington, D.C. is excluded because the supplied salary dataset does not contain a comparable D.C. salary figure.
What The Data Does And Doesn’t Tell Us
The results provide a state-level comparison of the relationship between dental implant prices and salaries.
They do not indicate what an individual patient will pay or whether a person can personally afford treatment.
Actual dental implant costs can vary based on clinical requirements, provider, location, implant system, restoration, additional procedures, insurance coverage, and financing.
Likewise, state median salary is a population-level measure and does not represent the earnings of every resident.
The findings should therefore be viewed as a financial affordability comparison, rather than an assessment of the quality or availability of dental care.
The Bottom Line
The financial burden of a dental implant varies considerably across the United States.
Louisiana has the highest implant-to-median-salary ratio at 6.78%, while Utah has the lowest at 4.50%.
The findings also show why price alone isn’t enough to understand dental affordability.
Louisiana’s average implant costs $1,596 less than California’s, yet the treatment represents a larger share of median annual salary.
The analysis suggests that understanding dental affordability requires looking at both the price of treatment and what people earn where they live.
Data sources
1: Dental implant pricing: Real Dental Costs, US Dental Restorative Cost Index by State (2026), Version 2.0.0.
2: Salary data: State-level average and median salary dataset supplied for this analysis.
All percentages and derived figures were calculated from the underlying datasets.