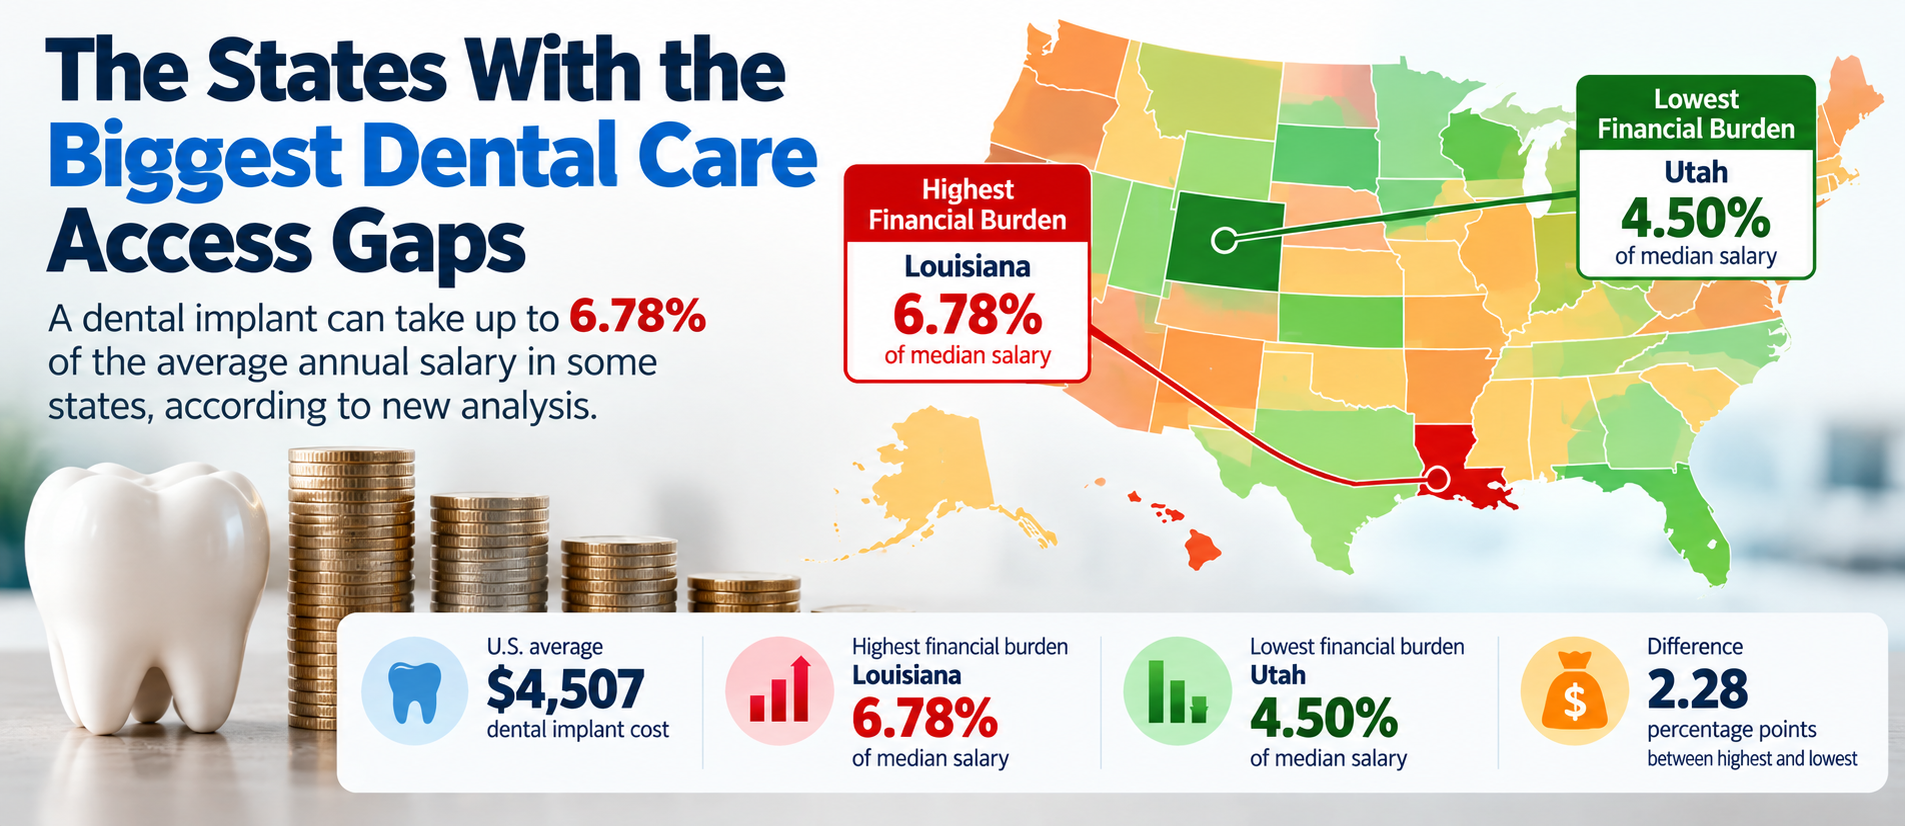
A new U.S. dental implant cost map reveals a nearly $2,000 difference between the most and least expensive states for a complete single dental implant.
Where you live could significantly affect the cost of replacing a missing tooth.
New 2026 data comparing the average cash price of a complete single dental implant across all 50 U.S. states and Washington, D.C., has revealed a $1,974 gap between the highest- and lowest-cost markets.
California has the highest average dental implant cost at $5,733, while Alabama has the lowest at $3,759.
With the national average standing at $4,507, the data highlights substantial geographic differences in the cost of implant treatment across the United States.
The U.S. dental implant cost map
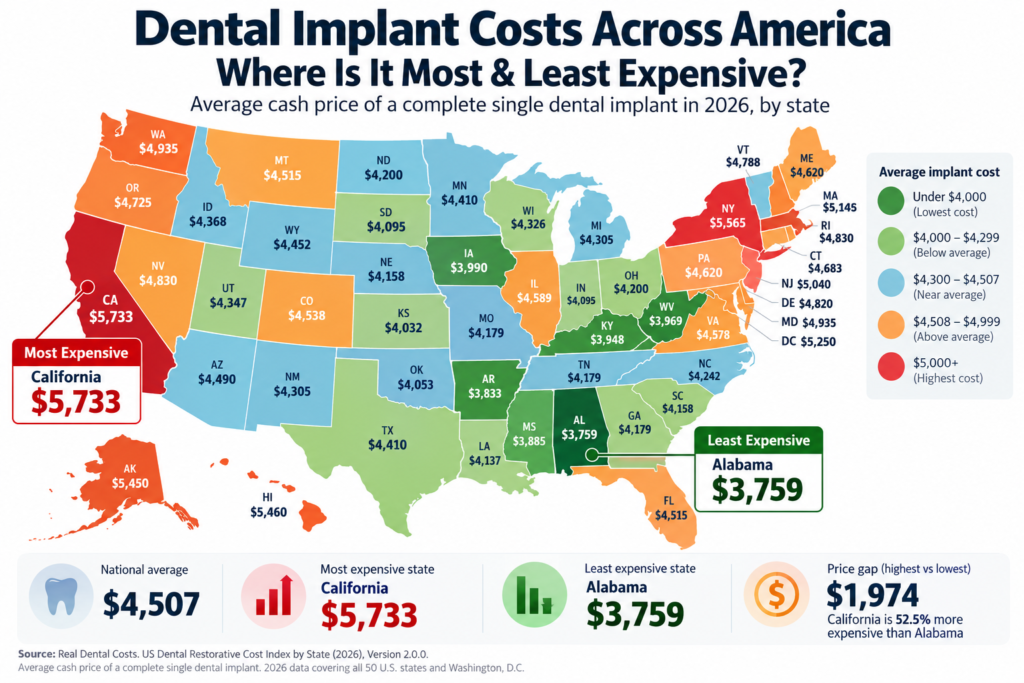
The map compares the observed average cost of a complete single dental implant across 51 U.S. markets.
Most expensive: California: $5,733
Least expensive: Alabama: $3,759
National average: $4,507
Difference between highest and lowest: $1,974
California’s average implant price is approximately 27.2% higher than the national average, while Alabama’s is approximately 16.6% lower.
California has the highest average implant cost
California ranks first among the 50 states and Washington, D.C., with an observed average complete single dental implant price of $5,733.
That is:
- $1,226 above the national average
- 27.2% higher than the national average
- $1,974 more than the lowest-cost state, Alabama
California’s Restorative Cost Index is 127, compared with the national benchmark of 100.
The state’s cost-of-living index is also relatively high at 137.6, providing additional context for its position in the implant-cost ranking.
Alabama has the lowest average implant cost
At the opposite end of the map, Alabama records the lowest observed average price at $3,759.
That puts the state:
- $748 below the national average
- 16.6% below the national average
- $1,974 below California
Alabama’s Restorative Cost Index is 83, compared with the national benchmark of 100.
Its cost-of-living index is 88.8.
The $1,974 difference between California and Alabama
The difference between the two states is particularly notable.
| California | Alabama | |
| Average implant cost | $5,733 | $3,759 |
| Difference from national average | +27.2% | -16.6% |
| Restorative Cost Index | 127 | 83 |
| Cost-of-living index | 137.6 | 88.8 |
| Difference between states | $1,974 |
Based on the observed state averages, an implant in California costs approximately 52.5% more than an implant in Alabama.
The most expensive states
California isn’t the only state where the average implant price exceeds $5,000.
The five highest-cost markets in the dataset are:
- California: $5,733
- New York: $5,565
- Hawaii: $5,460
- Alaska: $5,450
- Washington, D.C: $5,250
Massachusetts follows at $5,145, while New Jersey records an average of $5,040.
The concentration of several higher-cost markets in the Northeast and high-cost coastal markets provides an additional regional angle for journalists examining healthcare costs.
The least expensive states
At the other end of the ranking, the five lowest-cost states are:
- Alabama — $3,759
- Arkansas — $3,833
- Mississippi — $3,885
- Kentucky — $3,948
- West Virginia — $3,969
Iowa follows at $3,990, while Kansas records an average of $4,032.
Five states therefore have an observed average implant cost below $4,000.
How far can prices move from the national average?
The national average for a complete single dental implant is $4,507.
The lowest-cost state, Alabama, is $748 below that figure.
The highest-cost state, California, is $1,226 above it.
This creates a total spread of $1,974 from the bottom of the state ranking to the top.
The map therefore illustrates that the national average alone does not tell the whole story when comparing dental implant costs across the country.
What about states close to the national average?
Not every state falls dramatically above or below the national figure.
Several states are clustered around the $4,500 mark.
| State | Average implant cost |
| Arizona | $4,490 |
| Florida | $4,515 |
| Montana | $4,515 |
| Colorado | $4,538 |
| Virginia | $4,578 |
Arizona is particularly close to the national average, with an observed price of $4,490.
Florida and Montana are both at $4,515.
This means the geographic variation is not simply a divide between very expensive and very inexpensive states; a number of markets sit close to the national benchmark.
What does the map measure?
The map is based specifically on the observed average cash price of a complete single dental implant.
It does not represent the price of every type of dental treatment.
The underlying research distinguishes restorative dental procedures from orthodontic and cosmetic treatment because different dental markets can have different pricing patterns.
For this reason, the figures should be interpreted as a comparison of dental implant prices, rather than a general ranking of the cost of all dental care.
Why can dental implant prices differ?
The price of an implant can depend on a number of factors, including:
- Local operating costs
- Labor costs
- Cost of living
- Provider pricing
- The complexity of the patient’s treatment
- The type of implant and restoration
- Whether additional procedures are required
- Insurance coverage
- Financing arrangements
State averages therefore provide a useful way of examining geographic patterns, but they should not be interpreted as an individual patient’s final treatment quote.
Patients considering dental implants should obtain an individualized treatment plan and price from a licensed dental professional.
The bottom line
The 2026 U.S. dental implant cost map reveals a substantial difference between the highest- and lowest-cost states.
California has the highest observed average price at $5,733, while Alabama has the lowest at $3,759.
The $1,974 difference means that the average implant price in California is approximately 52.5% higher than in Alabama.
With a national average of $4,507, the findings demonstrate how much dental implant prices can vary across the United States.
Data source
Source: Real Dental Costs, US Dental Restorative Cost Index by State (2026), Version 2.0.0.
The dataset contains observed average cash prices for a complete single dental implant across all 50 states and Washington, D.C.
The research team reports that its implant state rankings were independently validated against the ASQ360°/CareCredit Average Procedural Cost Study, with a Spearman rank correlation of 0.945 across 51 markets.
The dataset was published under a CC BY 4.0 licence.
Research note: Percentage differences and comparisons in this article are calculated from the supplied 2026 dataset using $4,507 as the national average.